By Sally Pritchett
CEO
Following our recent Best Visualisation of Data award win at the DataComms Awards, we’re sharing how to bring data to life in your reports – so it’s not just seen, but understood.
When it comes to writing a report, the first instinct is often to include as much data as possible. But more data doesn’t always mean better communication – not because people don’t care about the data, but because the data isn’t doing enough to care about them.
In today’s digital-first world, where we’re constantly bombarded with information, reports need to do more than simply inform. It’s time to move away from overwhelming data dumps and start leading with insights that drive decisions, inspire action and deliver real value.
Here are some top tips to help you lead with insights in your next report:
Start with the ‘so what?’
You’ve got the data, and you may have even turned it into charts and visuals. Now it’s time to ask yourself, what does it mean? What should your audience take away? That’s where insight comes in.
An insight goes beyond the numbers. It connects the dots, explains why something matters and puts it into context for your reader – for their business, their industry and their priorities.
For example, instead of writing ‘Employee engagement scores dropped 4% this year’, try
‘A 4% drop in engagement suggests teams may be feeling disconnected – highlighting the need for increased leadership visibility.’
Don’t hide the insights
Not everyone reads a report cover to cover. They might skim read, search for the information most relevant to them or just scan the headlines and visuals.
Make sure your insights are easy to find and hard to miss:
- Include a short, punchy introduction or summary that pulls out key insights.
- Start each section of the report with a headline insight and end each section with a summary of key takeaways, actions or recommendations.
- Keep the detailed data to appendices so it’s there if needed but not blocking the story upfront.
Show the story, not just the stats
Even the clearest charts, graphs and visuals can fall flat if they’re not framed with meaning. Data alone rarely changes minds. But data backed by context and meaning? That can have an impact.
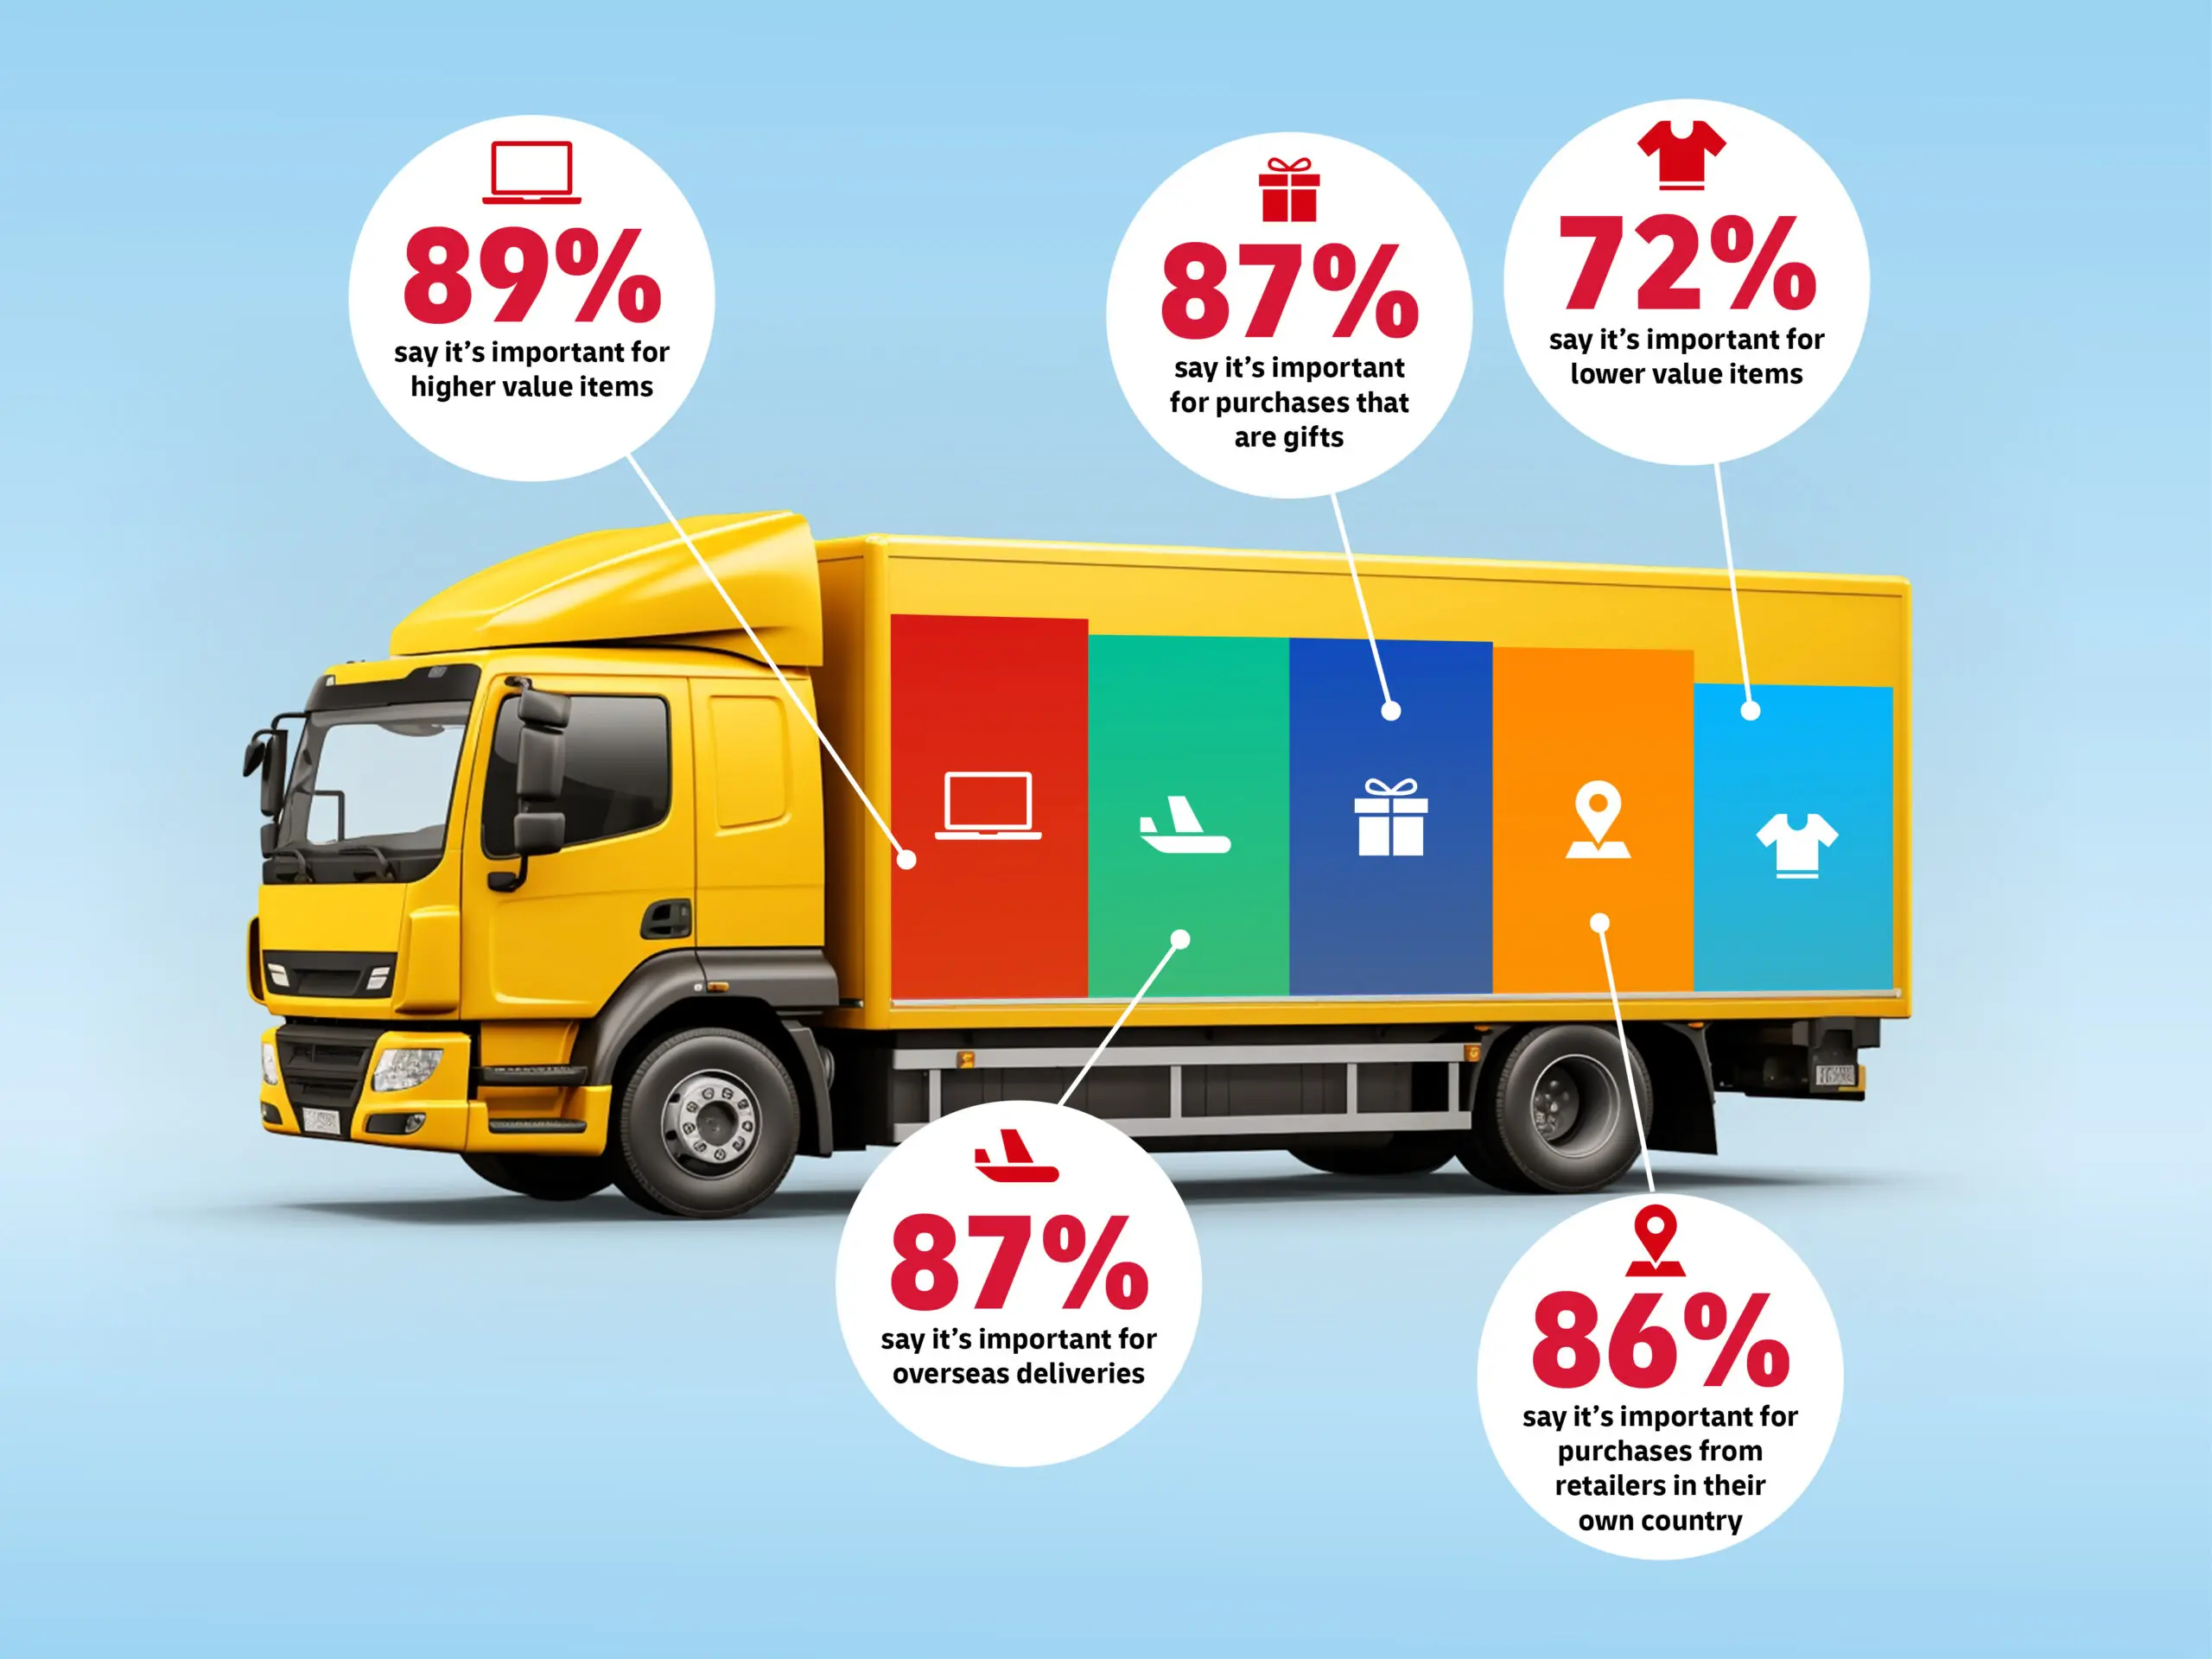
Giving the data meaning is exactly what helped our DHL eCommerce Trends Report win Best Visualisation of Data at the DataComms Awards. To bring insights to life, we created a series of visually engaging reports using real-world objects and relatable examples to illustrate key statistics. This made the data more relevant and easier to digest.
Bring your story to life with:
- Callout boxes for key insights and takeaways
- Real quotes or short case studies to humanise the numbers
- Icons or infographics to highlight trends and comparisons
Think about your audience from the start
Reports are more effective when they speak directly to their audience’s needs. So before you put pen to paper (or fingers to keyboard), ask yourself:
- What does your audience really want to know?
- What would make this report useful for them?
- How can these insights help them?
Build your report around what they need – not just what you have.
Be brave
It’s tempting to play it safe in reporting: present the facts, avoid interpretation, steer clear of conclusions. But in doing so, we miss the chance to lead. As communicators, our role is to highlight what matters – and help people do something with the information they’ve been given.
Don’t just present the data. Tell people what it means. That’s what turns a report into a decision-making tool, not just a data archive. Leading with insights doesn’t mean ignoring the data. It means shining a light on the meaning behind the data, so your audience can see clearly and act based on these insights.
Ready to create a report that gets noticed – and acted on? Explore our report design services to see how we can help you turn complex data into something insightful, accessible and award-winning. Or get in touch – we’d love to chat.